The right amount
of everything.
How much of each asset should you own? Explore 57 asset classes with current return models, dated sources and assumptions you can change. Test the mix against your goals. Free, in your browser.
- Full access with just an email
- No credit card
- Runs privately in your browser
57 ASSET CLASSES · 5 METHODS · 1,000 PATHS · 22 FREE TOOLS
Start with the question you came to answer.
How did my portfolio behave?
Bring holdings or use an example. Check the history and the available coverage.
Try it without signing up →Does my plan depend on optimistic growth?
Change one assumption. See the effect on purchasing power and monthly saving in your currency.
Try it without signing up →Could my retirement money run out?
Explore uncertain returns and spending with the free retirement simulator.
Try it without signing up →Three Workflows
Optimize. Simulate. Retire.
One platform for the full lifecycle of portfolio construction.
Optimize
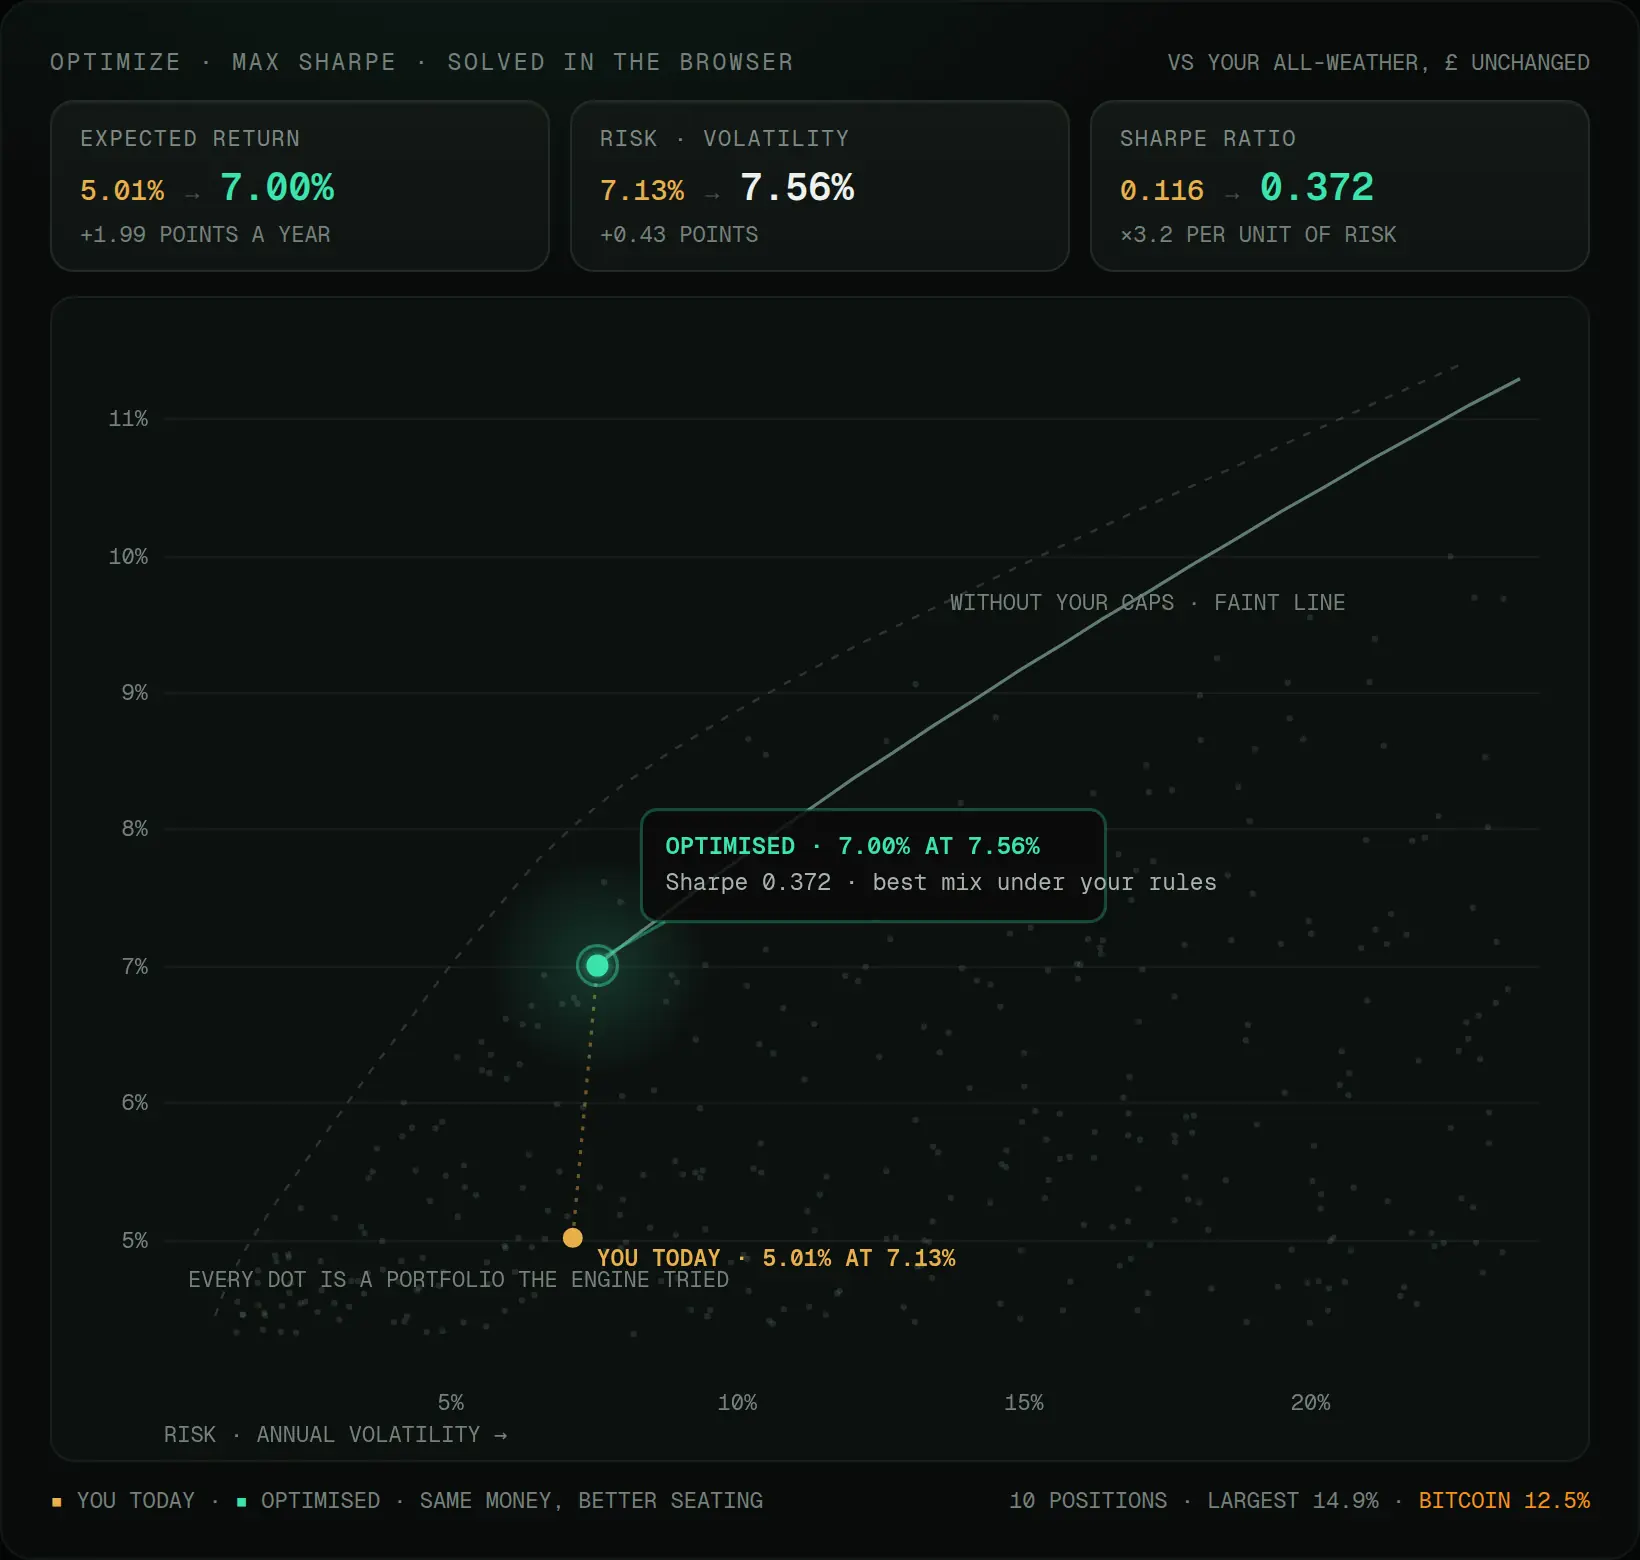
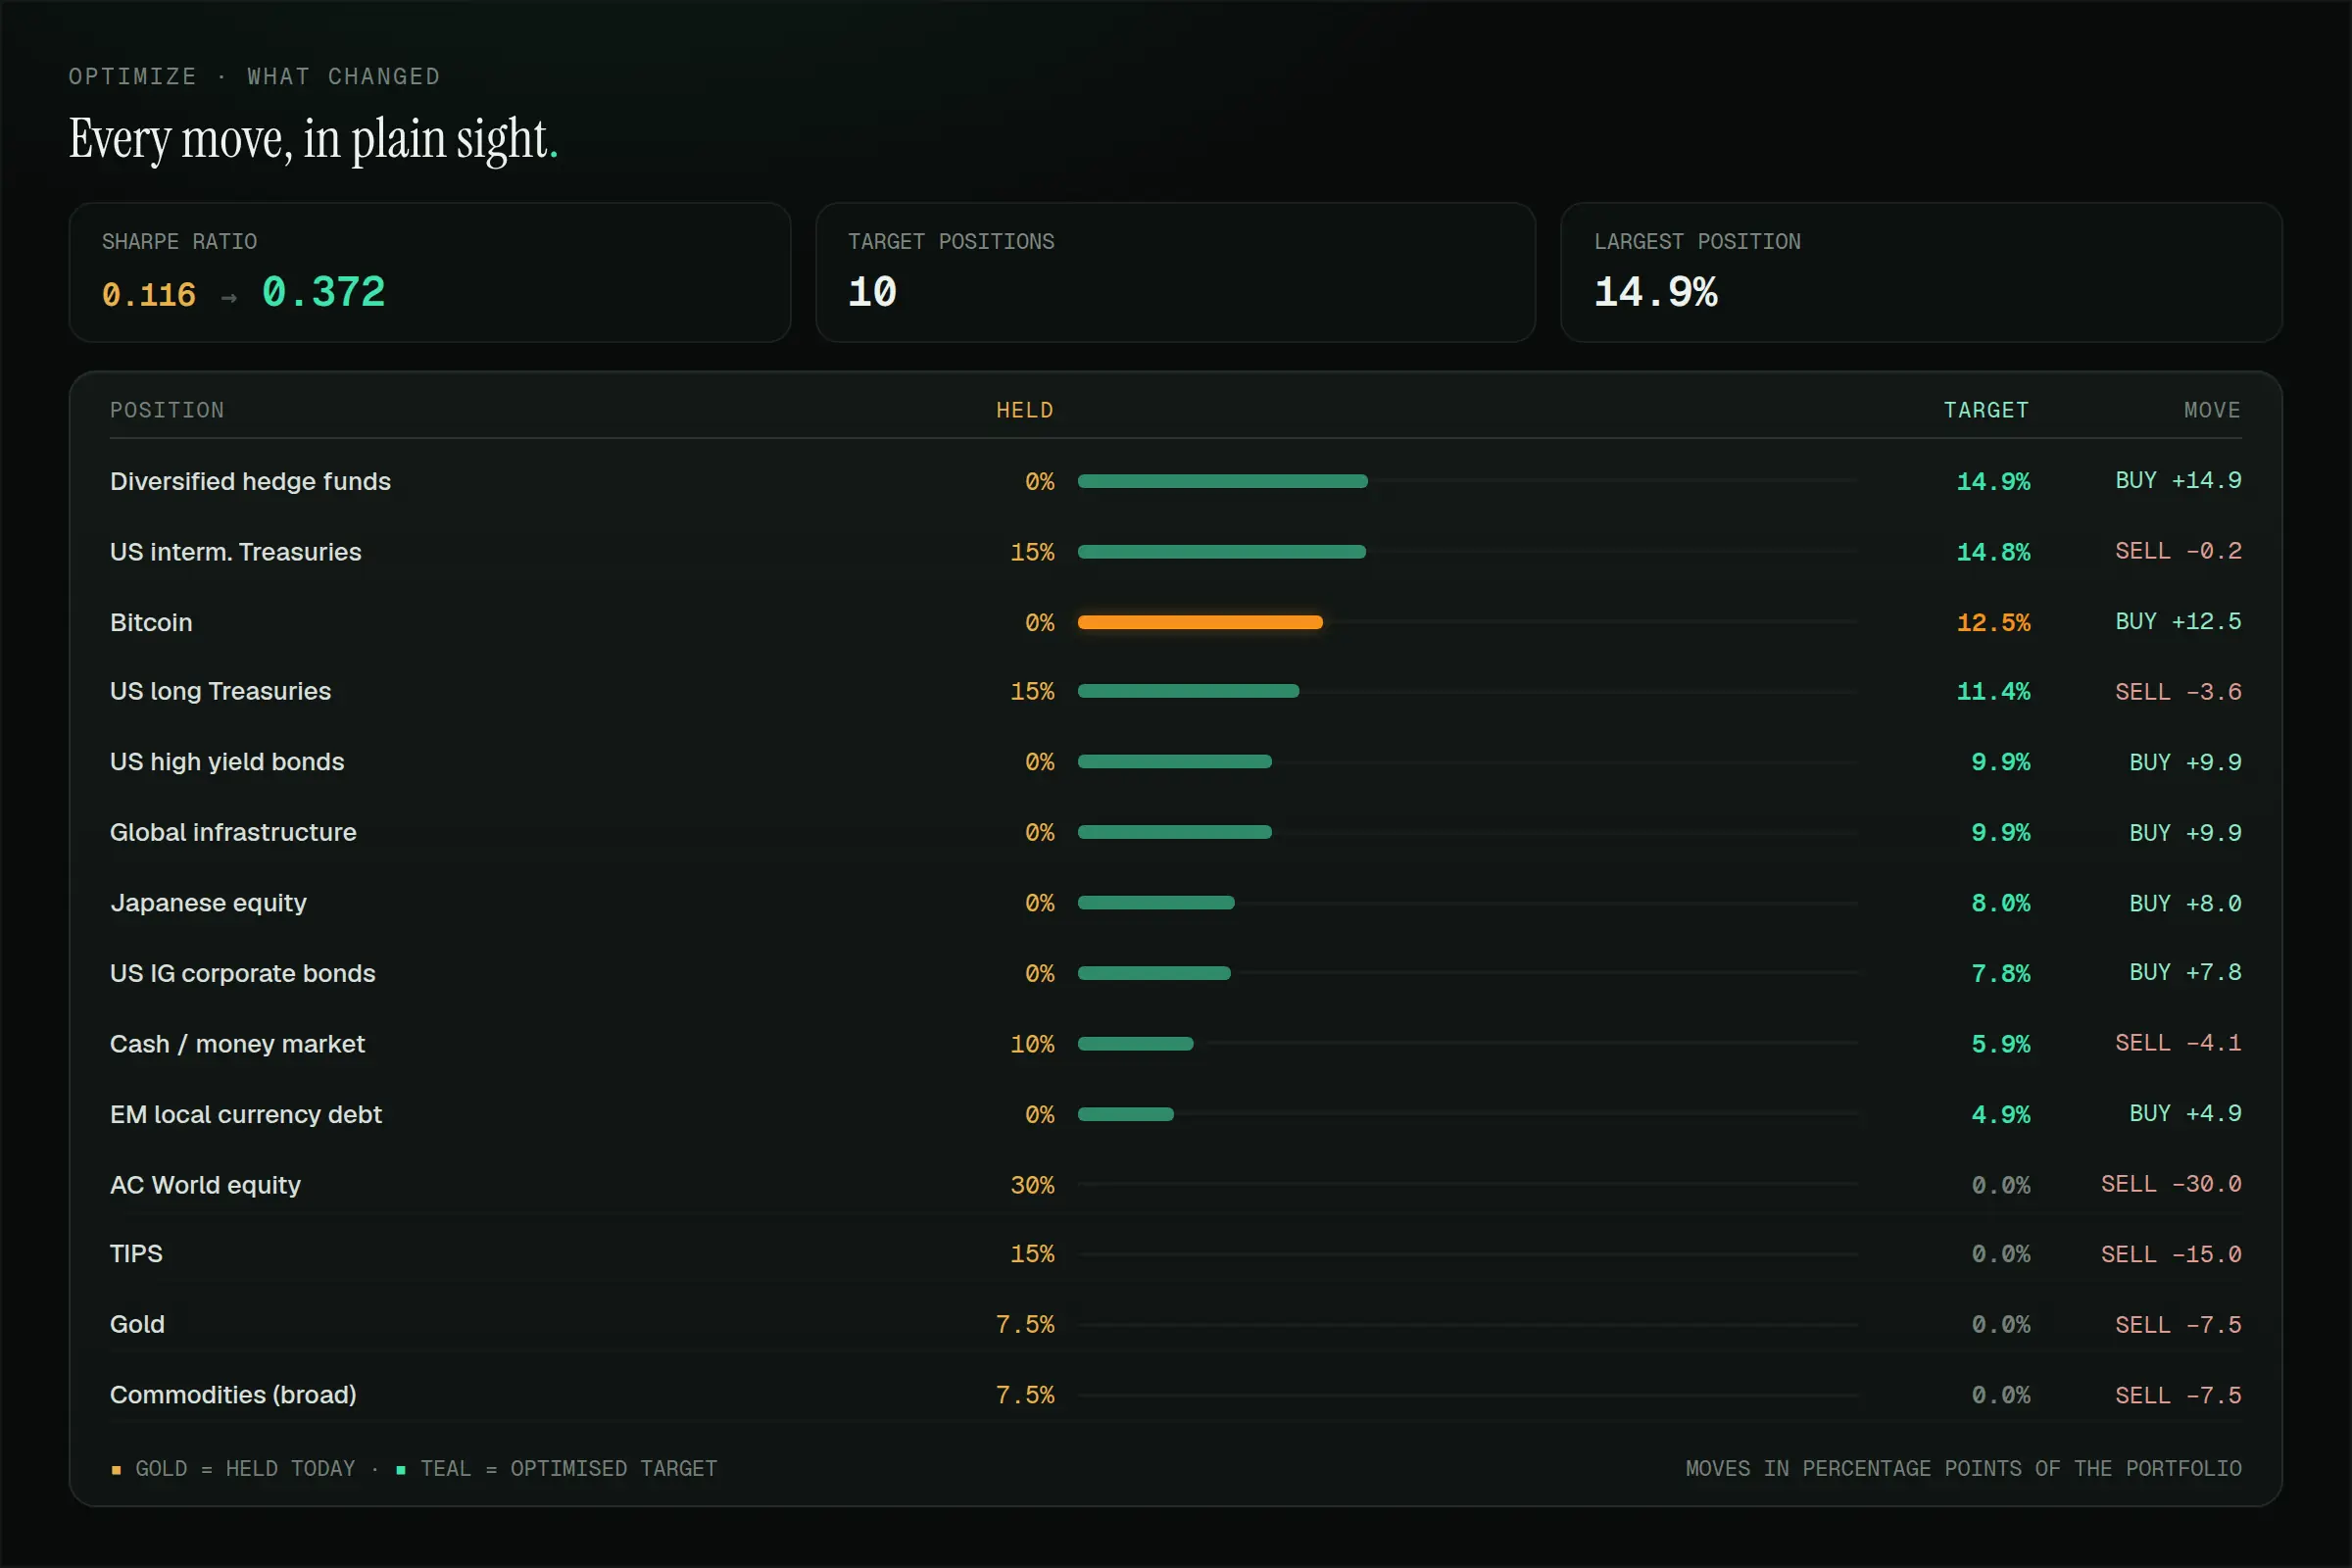
Hand it what you already hold. It returns a mix that earns more for each unit of risk taken, and names every trade that gets you there.
MAX SHARPE · MIN VARIANCE · RISK PARITY · HRP · BLACK-LITTERMAN
Simulate
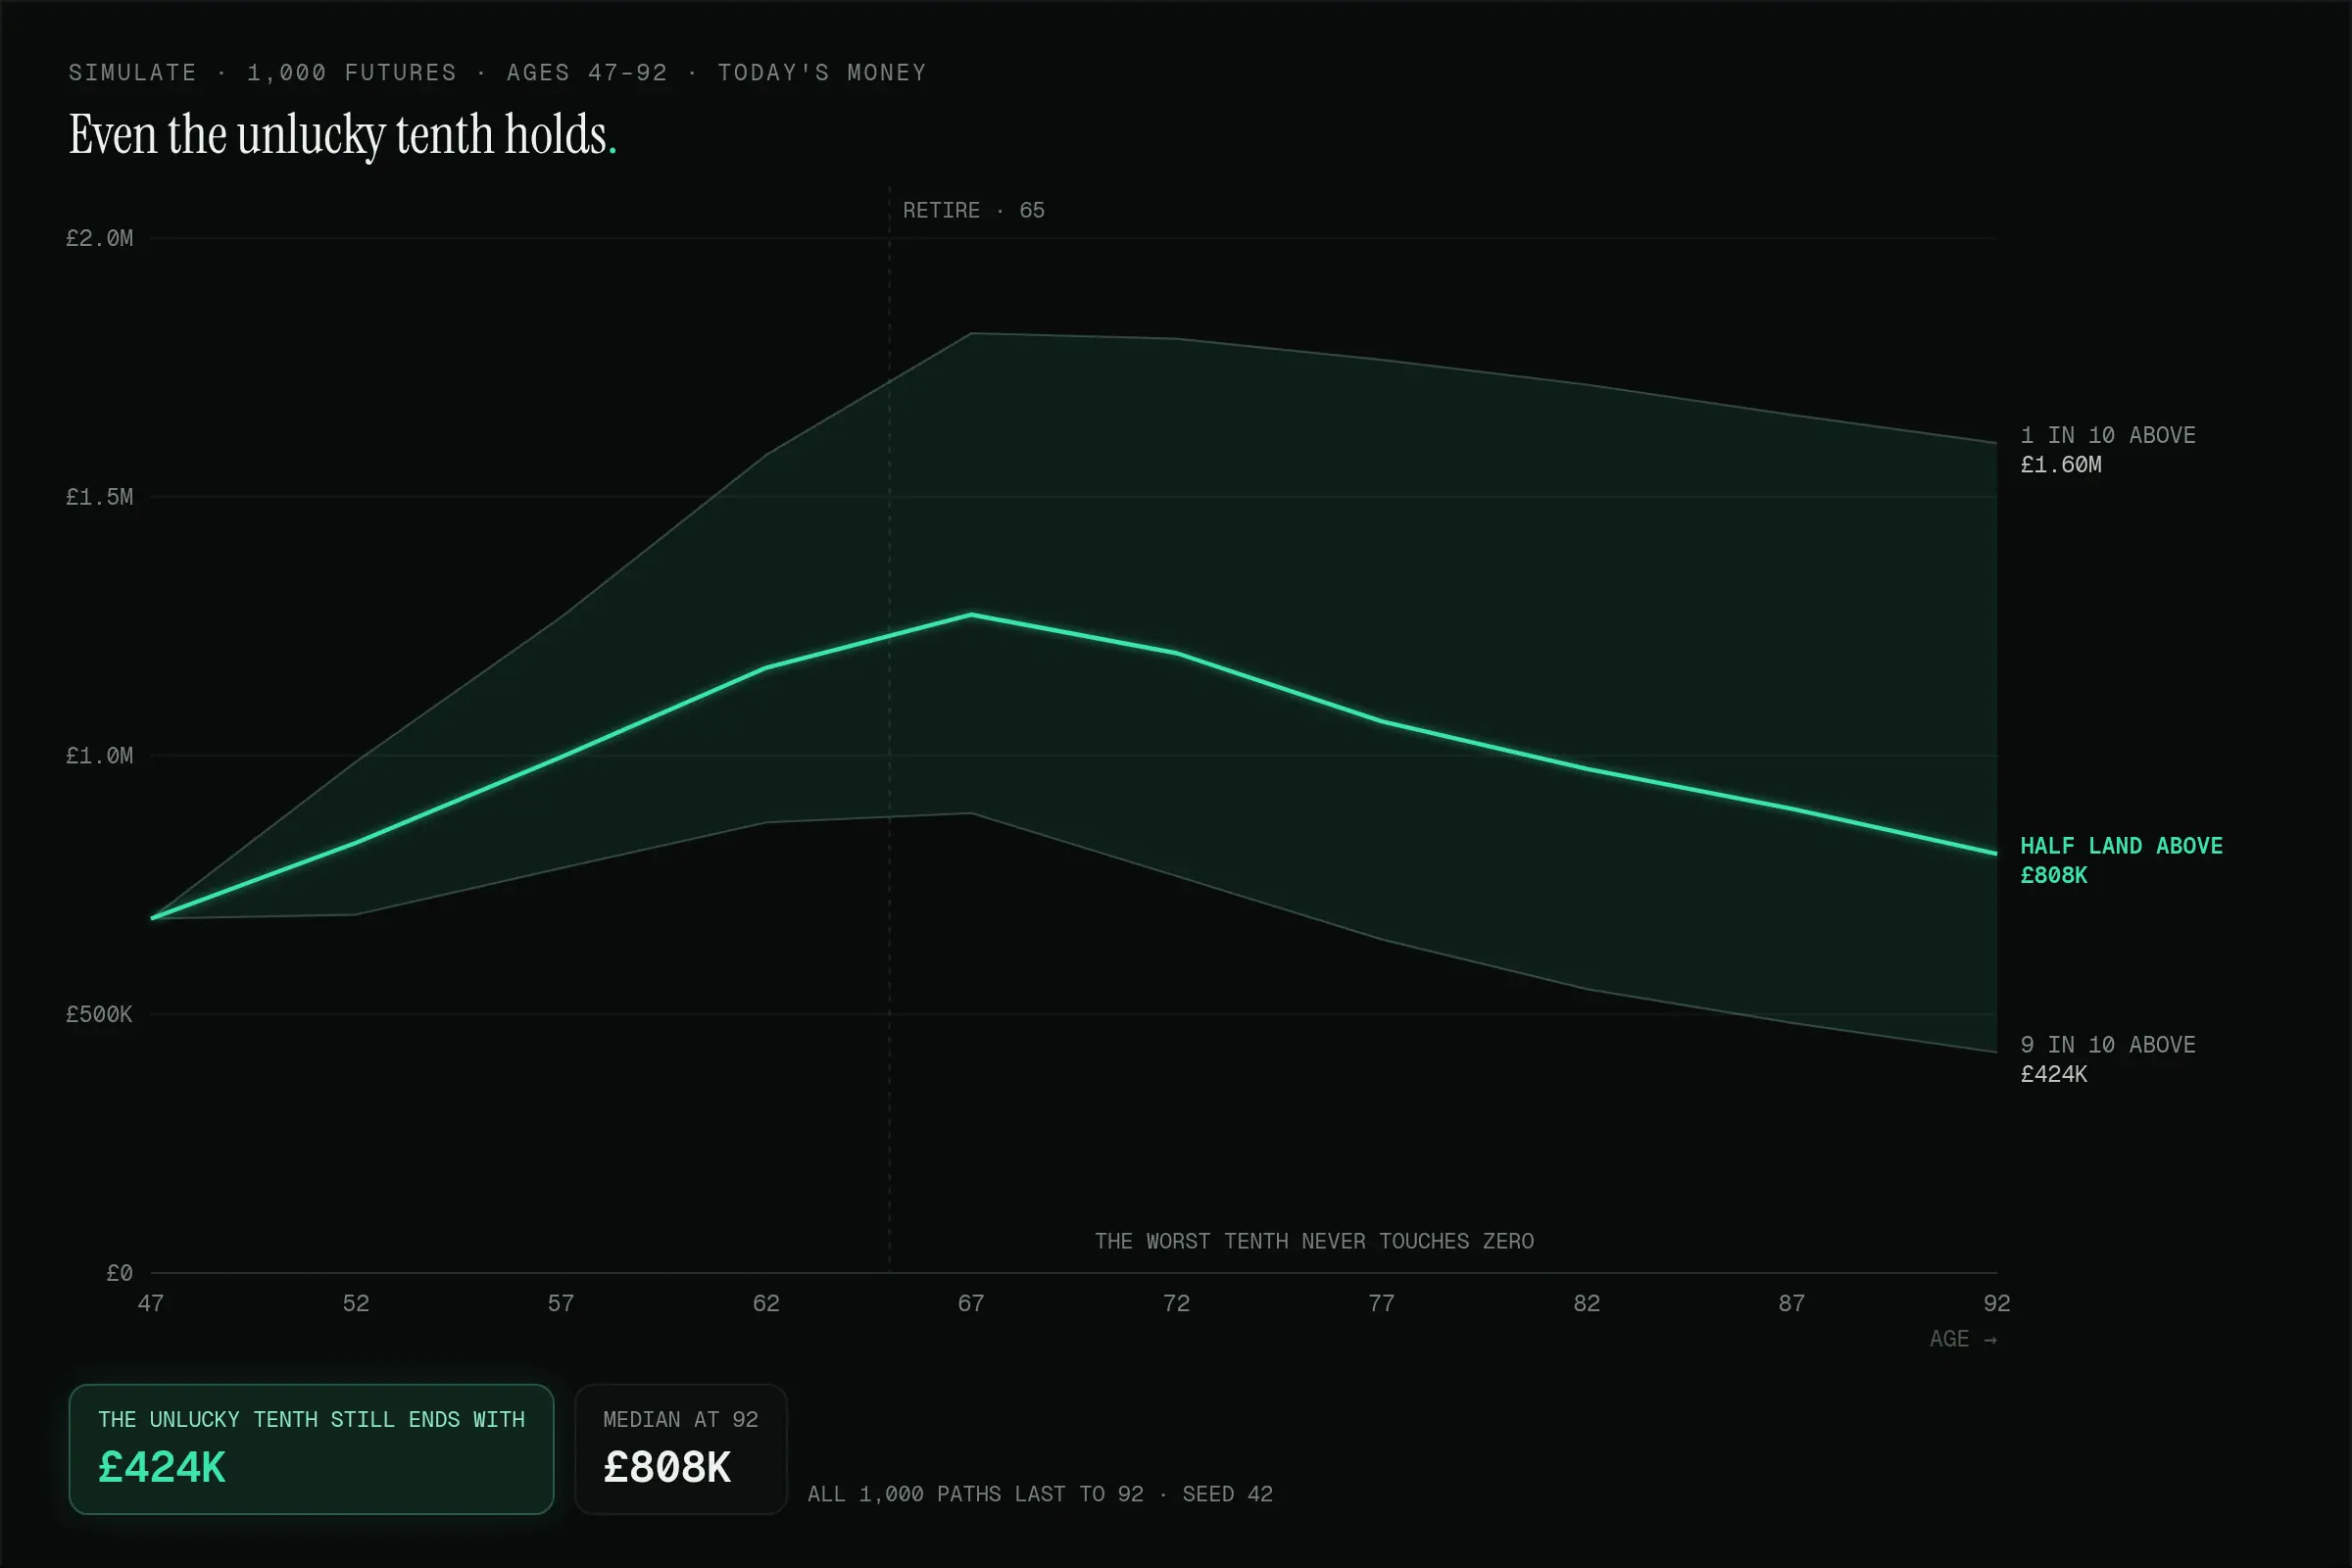
A thousand futures rather than one average one, so you see the unlucky quarter as clearly as the lucky one, and how long the money holds in each.
FAN CHARTS · GUARDRAILS SPENDING · TODAY'S MONEY · FULL RISK METRICS
Retire
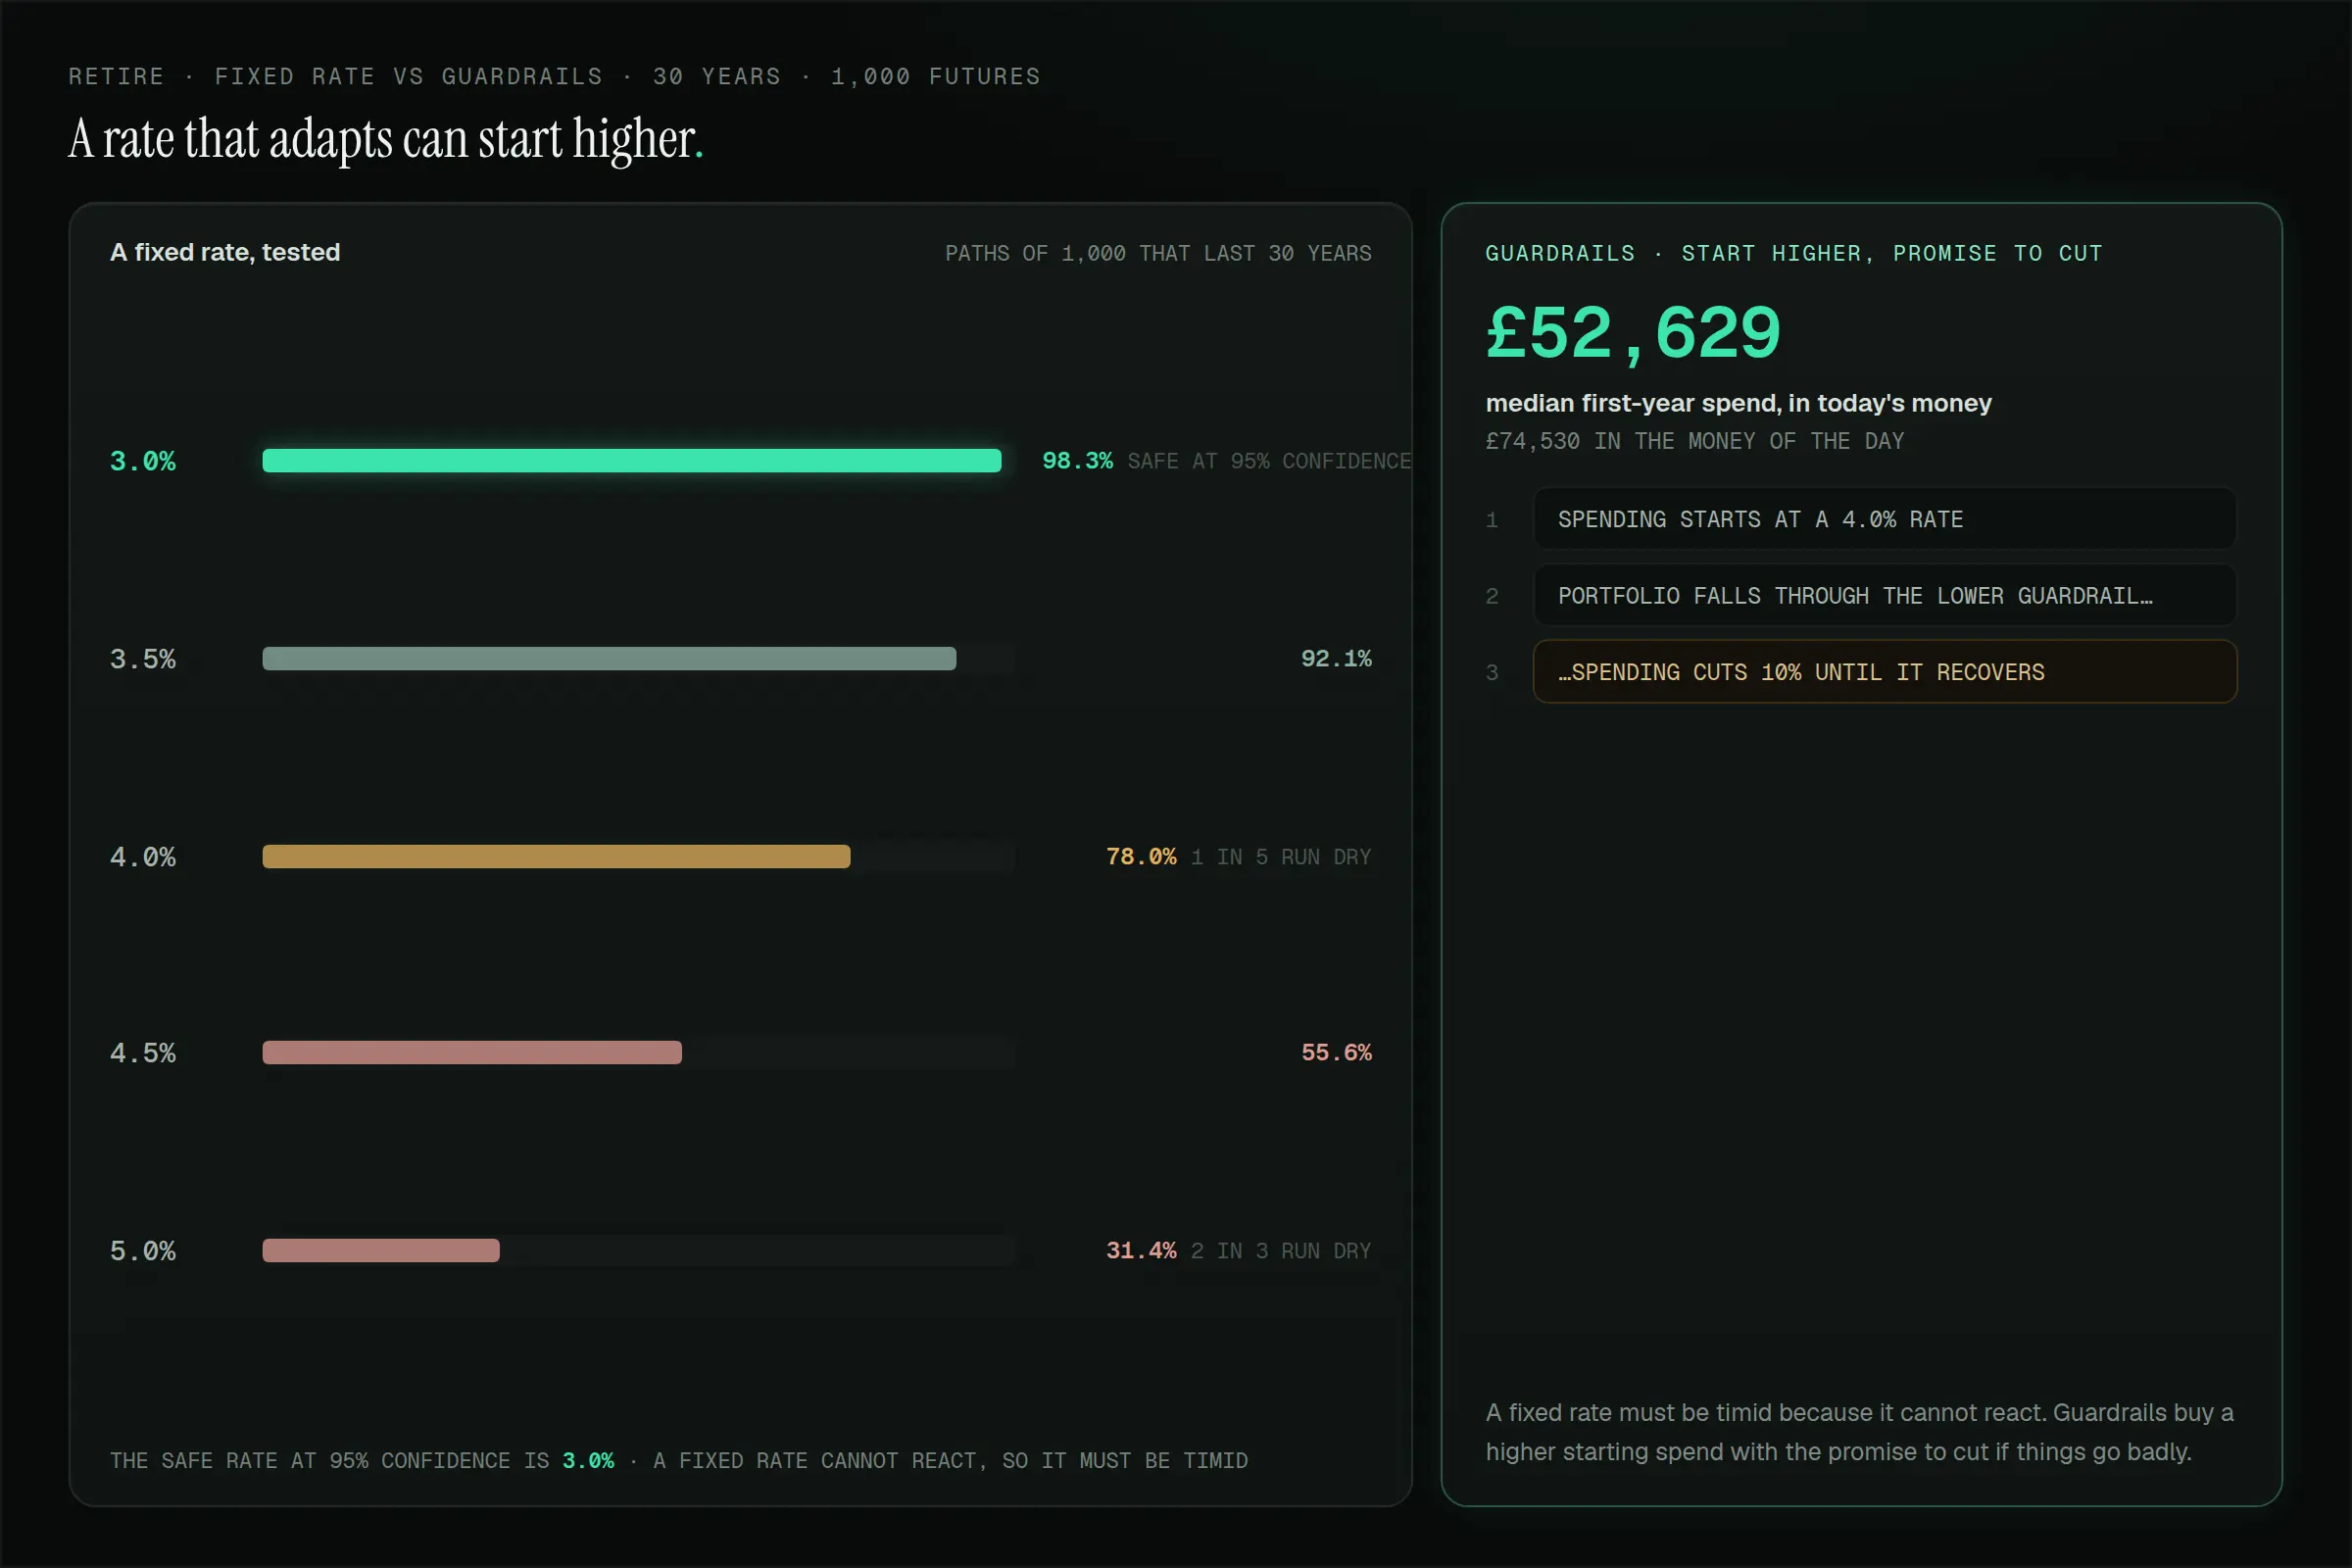
What you can actually spend, in dollars a year, with a strategy that raises the figure in good markets and cuts it in bad ones instead of hoping one rate holds for thirty years.
13 RATES × 7 HORIZONS · SURVIVAL HEATMAP · PER-CELL FAN CHART
Figures from the worked example that ships with the app, and from the same run the images beside them were drawn from.
five Published Editions
Priced in your money.
Switching currency changes what every asset is expected to return, its risk and its correlations. It does not just change the symbol in front of the number.
Their own edition, not a conversion
J.P. Morgan publish their capital market assumptions separately in five currencies. We read each workbook, so a sterling investor sees the sterling numbers J.P. Morgan actually published, with their ten-year currency view already inside them.
JPM 2026 LTCMA · ONE WORKBOOK PER CURRENCY
Your own market's history
UK gilts and corporate bonds, euro area government and corporate bonds, Canadian universe and long bonds, South African government bonds and equity. Monthly index and fund histories, with documented proxy segments where needed, so you can inspect the series behind each backtest.
MONTH-END SERIES · SOURCES AND JOINS DOCUMENTED
Hedged or unhedged, per holding
Currency-hedged share classes carry their own expected return and their own risk. Choose per asset, and the assumptions, the optimiser and the backtest all price the share class you chose.
HEDGING COST MEASURED FROM THE PUBLISHED PAIRS
Australian dollars and yen show your money in its own symbol over dollar assumptions, because J.P. Morgan publish no edition for them. The app says so on the screen. How the restatement works
The Difference
Why forward-looking data changes the answer
Historical analysis shows how an allocation behaved in a particular period. Forward planning also needs assumptions about what could happen next. Portfolio Lab lets you examine both, rather than treating one past outcome as a promise about the future.
Portfolio Lab builds forward-looking return estimates from dated market inputs and explicit assumptions. The workstation defaults to current benchmark models. Published investment-house forecasts remain separate comparisons, so you can inspect where the estimates agree and where they differ.
Open Assumptions to see each asset’s method, input dates and editable building blocks. Change an assumption or enter your own return, then rerun the analysis to see how the result changes. A detailed model still has uncertainty; the purpose is to make those choices visible, not to promise what markets will do.
The public calculators run in your browser and need no account. A free account opens the full workstation for saved portfolios, analysis and reports. You can explore the tools before deciding whether to sign up.
57 ASSET CLASSES · 5 METHODS · 1,000 PATHS · NO CARD
The Universe
Every asset it knows, to scale
All 57 asset classes, drawn from the same registry the optimizer solves against. Nothing here is decoration.
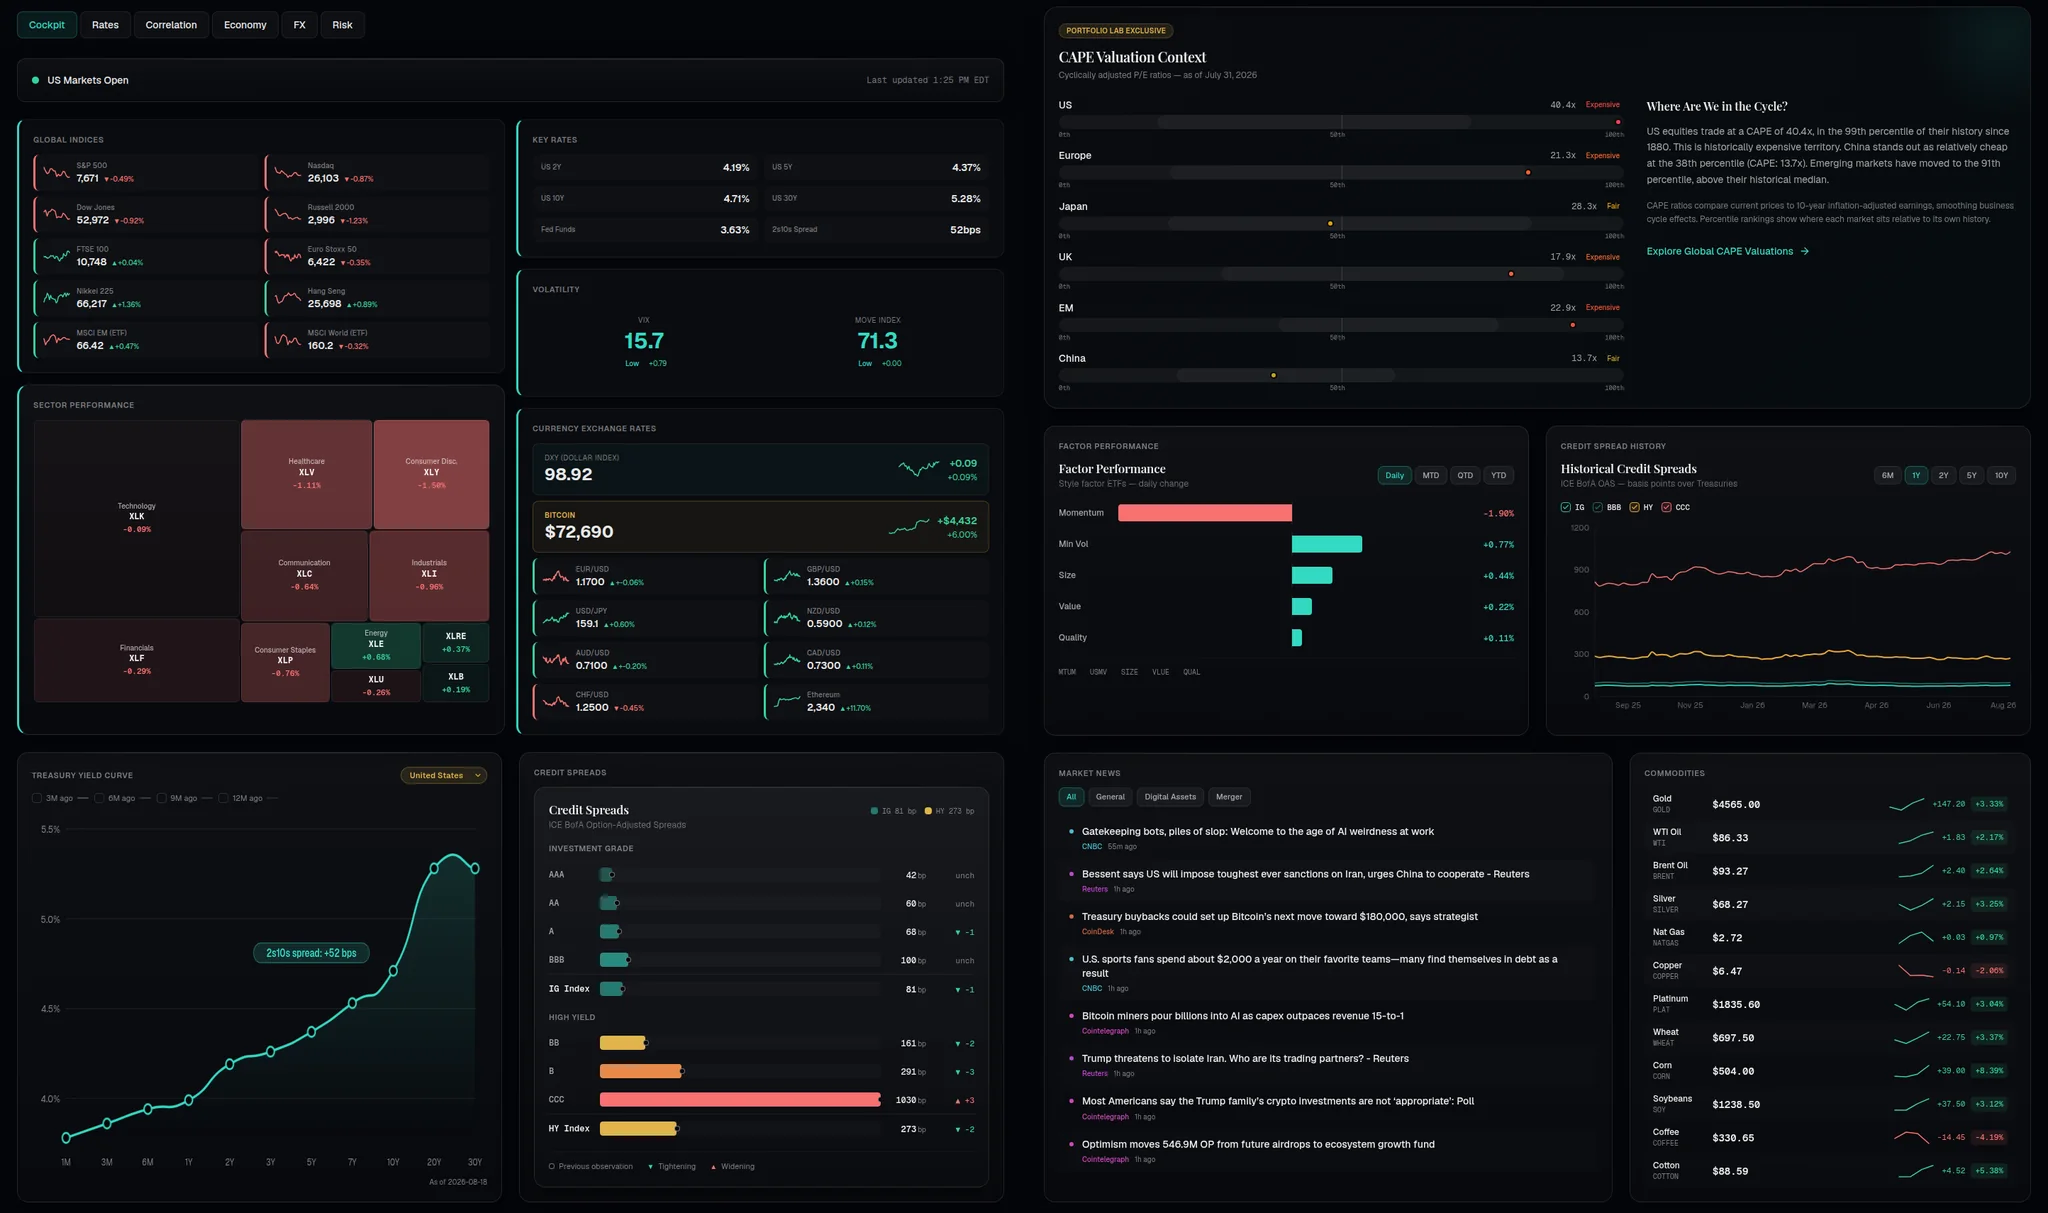
Live Data
The whole macro picture, one view
Indices, yield curves, credit spreads, CAPE valuations, factor performance and FX, in one view, with the levels that matter marked.
Try Before You Sign Up
22 Free Tools
Every one runs right now with no account. A free account adds the rest: all 57 asset classes, saved portfolios and PDF reports.
Markets & valuation
Portfolio construction
Retirement & withdrawal
Explore
Reference allocations, research, and guides
Model Portfolios
Research
Where to start
All four →Pricing
Free. No catch.
One plan. Everything included. No credit card required.
- +57 asset classes with editable forecasts
- +5 optimization methods incl. Black-Litterman
- +Monte Carlo simulation with fan charts
- +Retirement analysis with survival heatmaps
- +Historical backtesting back to 1926
- +Live market dashboard with CAPE valuations
- +Bitcoin & custom ticker support
- +PDF reports & unlimited saved portfolios
- +5 base currencies, each with its own assumptions
Sign up with an email and the whole platform unlocks. That's it.
Questions
Frequently asked questions
Is Portfolio Lab really free?
Yes. Portfolio Lab is free software, not a free trial. The public tools work with no account at all, and a free account (just an email, no credit card) unlocks the full platform: the complete 57-asset optimizer with all five methods, Monte Carlo simulation, retirement analysis, unlimited saved portfolios, and PDF reports. There is no paid tier waiting to upsell you.
Is Portfolio Lab a website or software?
It works like software: a full portfolio construction application that happens to run in your browser. There is nothing to install and nothing to update. Sign up free with an email and you get the complete optimizer, simulation, and reporting suite, with every calculation running privately on your own device.
What optimization methods does it use?
5: Maximum Sharpe, Minimum Variance, Risk Parity, Black-Litterman with custom views, and Hierarchical Risk Parity, applied across 57 asset classes. These are the same methods used by institutional multi-asset teams.
What data are the numbers based on?
The workstation defaults to Portfolio Lab’s current benchmark models, using dated market observations and explicit assumptions. Each forecast has its method and source dates in Assumptions. Published institutional forecasts remain separate references. You can change supported building blocks or enter your own return, then rerun existing results. Risk estimates use the app’s return-series and benchmark methodology. Historical backtests use historical returns, not future forecasts.
Do I need a finance background?
No. Each tool explains what it does in plain language and handles the maths for you. When you want the detail, the full methodology documents every formula and data source.
Is my portfolio data private?
Yes. Every calculation runs in your browser. Your holdings, allocations, and projections never leave your device and are never sent to a server.
Can I analyze Bitcoin in a portfolio?
Yes. Bitcoin is a first-class asset with its own forward-looking assumptions, so you can size it with mean-variance optimization, backtest it inside a 60/40, and stress-test it in retirement rather than guess.
Start building better portfolios
One email gets you the full platform: optimizer, simulations, retirement analysis, and PDF reports. Free, with no credit card.
Create Free Account